FISHBONE (ISHIKAWA) TOOL AUTOMATED TEMPLATE

Updated: Sep 30
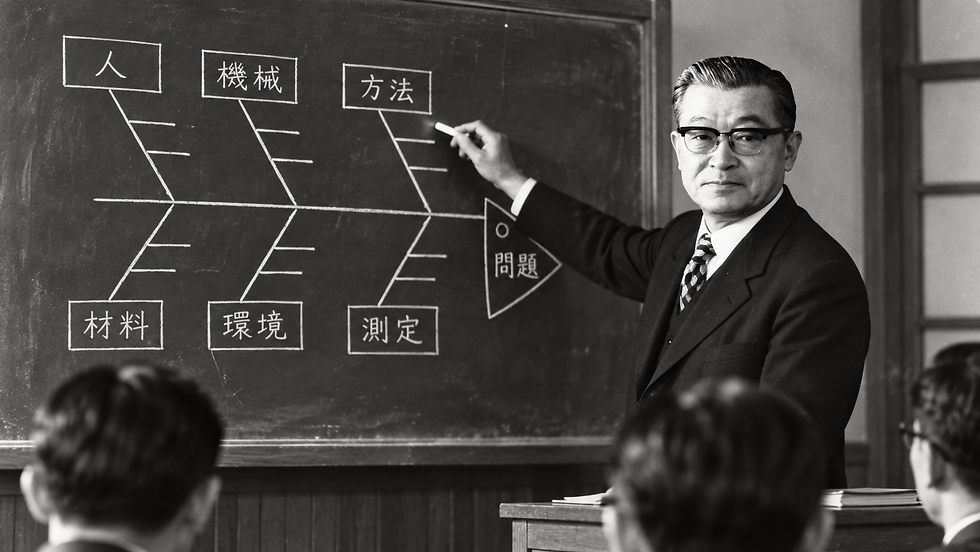
Professor Kaoru Ishikawa is widely recognized as one of the most influential figures in the field of quality management. Among his many contributions was the development and promotion of the concept now commonly known as the Seven Basic Tools of Quality. While several of these tools, such as histograms and tally sheets, had already been used in various forms for many years, one tool in particular bears Ishikawa’s name: the Ishikawa Diagram, also widely known as the Fishbone Diagram.
The Ishikawa Diagram can be applied in a wide range of situations, but in our experience, it is particularly valuable during brainstorming sessions. It provides a structured way to organize and visualize the ideas generated by grouping them into main categories and relevant subcategories. This makes it easier to identify potential causes, explore relationships, and develop a more comprehensive understanding of the issue at hand. To help you apply this method in practice, we have provided an Ishikawa Diagram tool below:

Comments